Visual Analytics for Astronomy Time Series Analysis
Nicholas Ruta
Why does this matter?
Astronomy surveys contain millions of objects causing a significant time requirement to do manual classification. Many stars remain unclassified. These stars are represented as a time series. In order to make new discoveries, we will need scalable Astroinformatics systems. We built a time series search engine that allows scientists to explore and isolate interesting observations to find similar time series in a database.
Big Data is Transforming How Astronomers Make Discoveries.
The next game-changer is likely lurking in the data we already have—but it will take scientists years to uncover it.
Smithsonian.comLSST is the lighthouse project.
Astronomy is undergoing a revolution in the way we probe the universe and the way we answer fundamental questions.
LSST: InnovationAstronomy relies heavily on computer modeling.
Due to new detectors and innovative telescopes, today’s astronomers can observe objects in unprecedented extend and with high resolution.
h-its.org

We used data from two Astronomy Surveys.
The Catalina Sky Survey (CSS) is a NASA funded project that involves searches for rapidly moving Near Earth Objects (NEOs)
The VVV Survey data products offer a unique dataset to map the stellar populations in the Galactic bulge and the adjacent plane.
Kernelized Cross-Correlation Distance Metric
We use a kernelized cross-correlation distance metric to compare light curves (astronomy time series) based on their morphology. We pre-process the light curves by folding them based on their period and using interpolation and standardizing to produce evently spaced observations on a similar scale. Finally, we compute and maximize the distance between two light curves with a kernelized cross-correlation score using phase shifting.

- Raw Data
- Fold the light curve
- Interpolate
- Standardize
- Compute Cross-Correlation
- Compute Kernelized Correlation as a Disatnce Measure
Feature-based Distance Metric
Using the feature space of our time-series data, we can compute the weighted arithmetic mean as a distance metric. The feature space provides a scalable way to explore large time series databases. It allows us to enhance our similarity searches and identify interesting observations using a potentially lower-dimensional space. We can select weighted features based on a specific profile to encourage the search results.
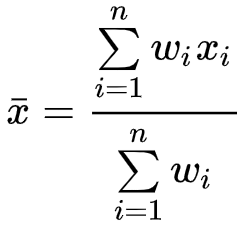
- Calculate the weighted arithmetic mean as the
- sum of the product of
- the individual assigned weights (w)
- and corresponding features (x)
- for each time series feature (n)
- divided by the sum of all the weights (w)
Feature-based Search
We use parallel coordinates to explore the feature space of the databse where each column represents a feature. Different ranges can be selected to explore & isolate examples with which a similarity search can be based on.
Try it live (click the "Explore the Data" button)
Fine-tuned Results
First, select the features important for your desired search profile. Next, decide whether to compute similarity metrics using the standardized or non-standardized version of the light curves. Finally, search for the most similar in the database using a specific observation.
Try it live
Visual Analytics
The "target" light curve (which the search was based on) is shown in green. The left half of the screen contains a search results cluster at the top. The target is at the center, closer nodes are more similar based on the cross-correlation metric. Each node in the cluster has a bar to the right which expresses feature space distance to the target.
Below the cluster, a one-to-many comparison chart shows the target's overall shape compared to the top 30 most similar in the database. To the right, a one-to-one comparison is plotted showing the target directly compared to the most recently hovered object from the cluster.
The right half of the screen is a table of the feature space for the 30 most similar observations in the database. The most recently hovered node on the cluster is highlighted in blue on the table while the most recently hovered row on the table is highlighted in orange on the cluster.
You can click a node on the cluster or a row on the table to search with that observation as the new target.
Try it live (click "Get Time Series")
Visual Analytics for Astronomy Time Series Analysis
We built this time series search engine application to enable a target-based search in order to find similar time series in a database. We demonstrated its capabilities using two astronomy light curve surveys. To allow scientists to explore and isolate interesting examples, we provided parallel coordinates to probe the feature space and a visual analytics dashboard to interact with search results. Further, new light curves of interest can be selected for a new similarity search.
Live Demo
Future Work
We feel that two improvements in particular are of the utmost importance. First, we are only using 2,000 total light curves in the current demo version due to scalability issues. We feel that utilizing parallelization and improving the database architecture are needed to scale with the billions of light curves expected to be available in the near future. Second, we have receieved positive feedback about this system but are always asked if new light curves can be added to the database. Ultimately, users should be able to upload their own light curves to see what they are similar to in a massive database containing all available astronomy surveys.
Project Info
Contact
Live Demo
References
Data Sources
Publications
1 Kernels for Periodic Time Series Arising in Astronomy
2 FATS: Feature Analysis for Time Series
3 P4J